Graph Theory
Exercise Solutions
Exercise 1
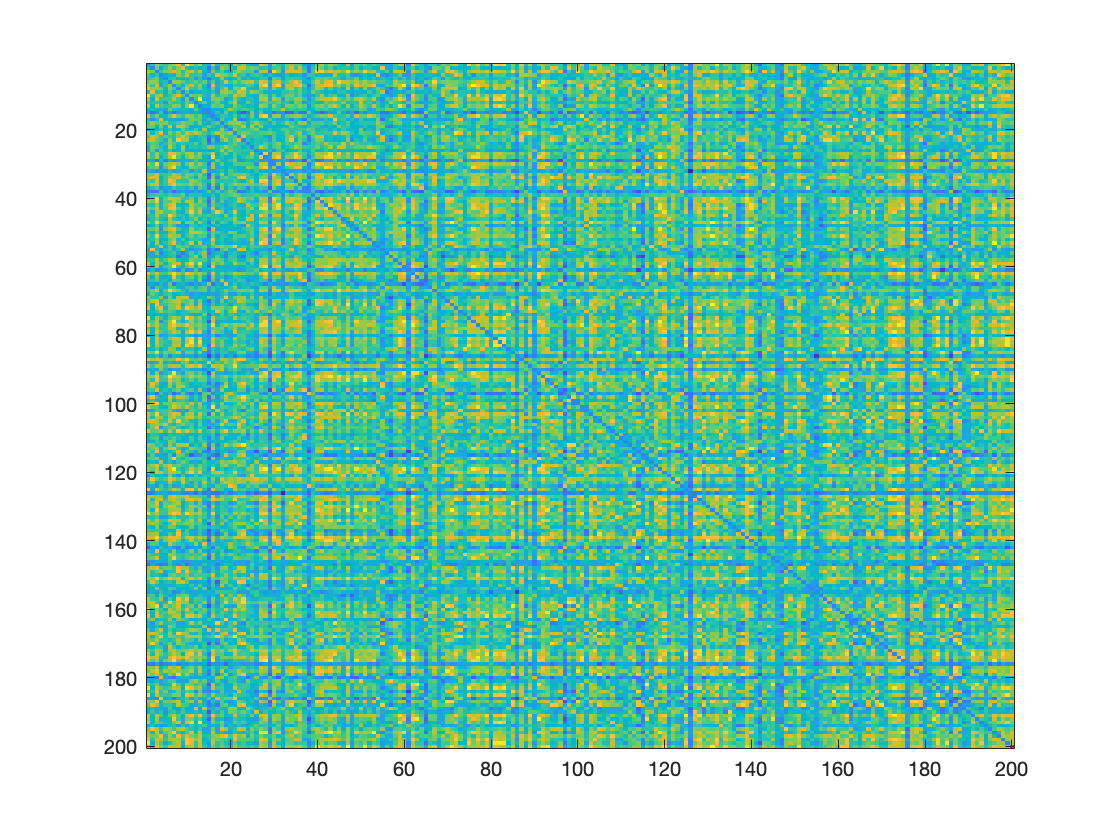
Connectivity Matrix
imagesc(matrix)
Exercise 1
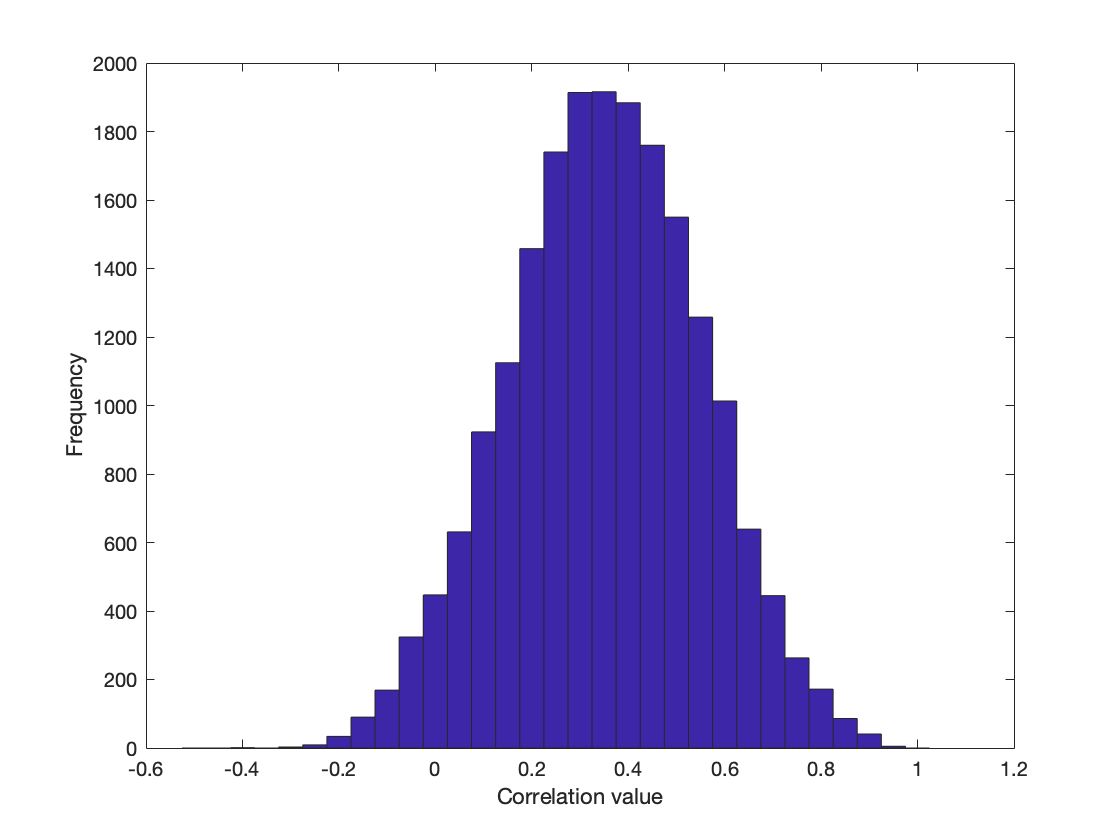
Plotting the correlation distribution:
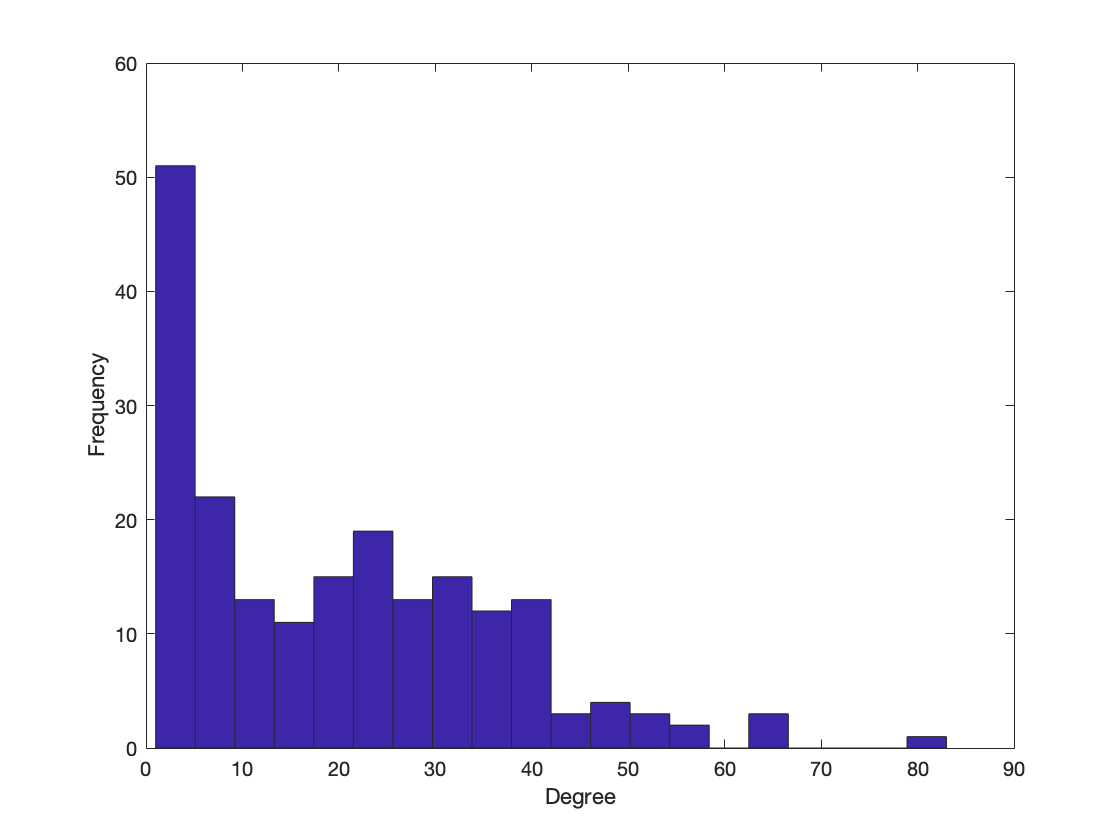
degree = sum(matrix_thresh);

% plot the correlation distribution
figure;
hist(degree,20);
xlabel('Degree')
ylabel('Frequency')
Exercise 1
Correlation Distribution
Exercise 1
Degree Distribution
Exercise 1
Calculating the mean shortest path length $L$ and the clustering coefficient $C$, for your thresholded, binarized network:
C = mean(clustering_coef_bu(matrix_thresh));
L = charpath(distance_bin(matrix_thresh));

% Values for C and L: C = 0.49, L = 2.93
Exercise 2
Generating null networks:
randmatrix = cell(1,100);

for ind = 1:100
  [R,eff] = randmio_und_connected(matrix_thresh, 10);
  randmatrix{1,ind} = R;
end
Exercise 2
Calculating $C_{r}$ and $L_{r}$:
for ind = 1:100
  C_rand(ind) = mean(clustering_coef_bu(randmatrix{1,ind}));
  L_rand(ind) = charpath(distance_bin(randmatrix{1,ind}));
end

mean(C_rand) % = 0.25
mean(L_rand) % = 2.3
$\sigma = \frac{0.49/0.25}{2.9/2.3} = 1.6 > 1$
→ We have a small-world network!