How to inspect surface data
 White Matter surface reconstruction overlaid on T1-weighted image
written for the Diedrichsen Lab & Brain and Mind Institute.
About this guide
This guide describes some useful checks of different types of image data. In particular, it focusses on checking reconstructed surfaces from anatomical data, registration and normalization checks as well as final inspections of group estimates of functional activity.
Surfaces
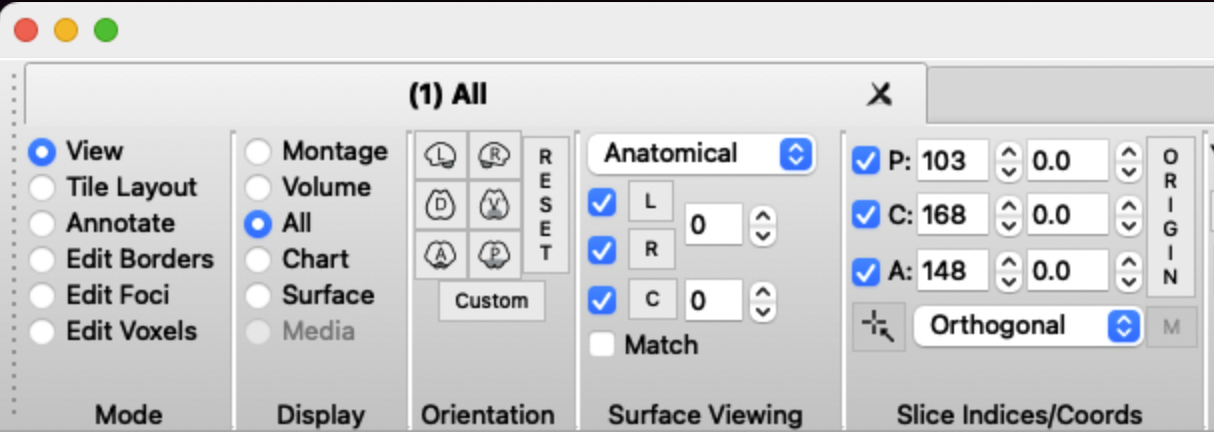
To check that surfaces were reconstructed correctly and match the T1, pull up workbench:
wb_view
Pial Surface
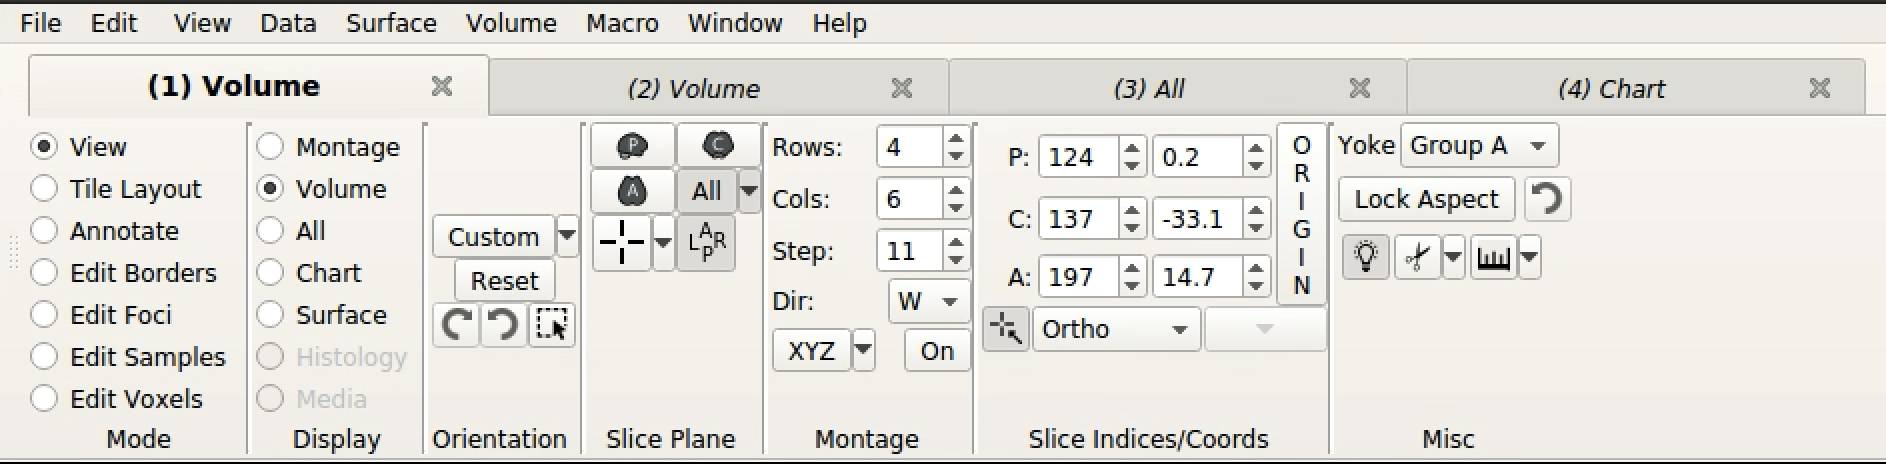
Open the native space T1 (for example sub-01_T1w.nii) and the pial surfaces for the left and right hemisphere (sub-01_space-32k_hemi-L_white.surf.gii & sub-01_space-32k_hemi-R_pial.surf.gii ). In the montage tab, click on All (is set to Montage by default). You might have to also click On for the T1 image in the overlay toolbox to show the T1.
You should now see the T1 image and reconstructed pial surface. Rotate the image to see whether the surface is aligned with the sulci in the T1. An extreme mismatch would look like this:
A subtler mismatch of the right hemisphere could look like this:
And here is a perfect match between pial surface and T1 image:
White Matter Surface
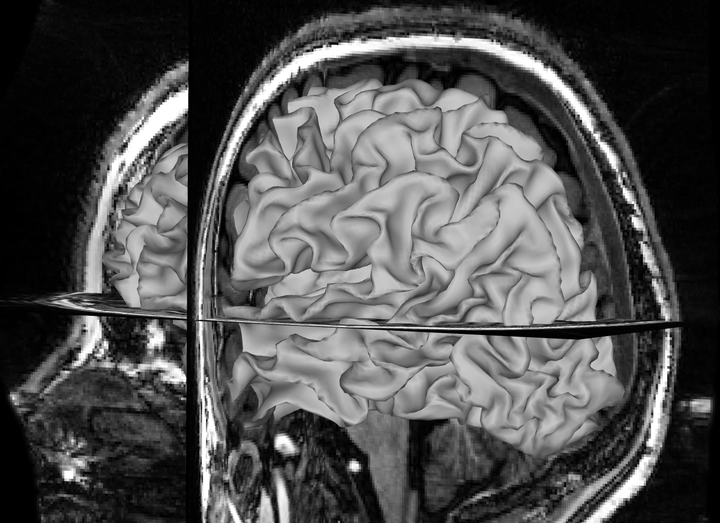
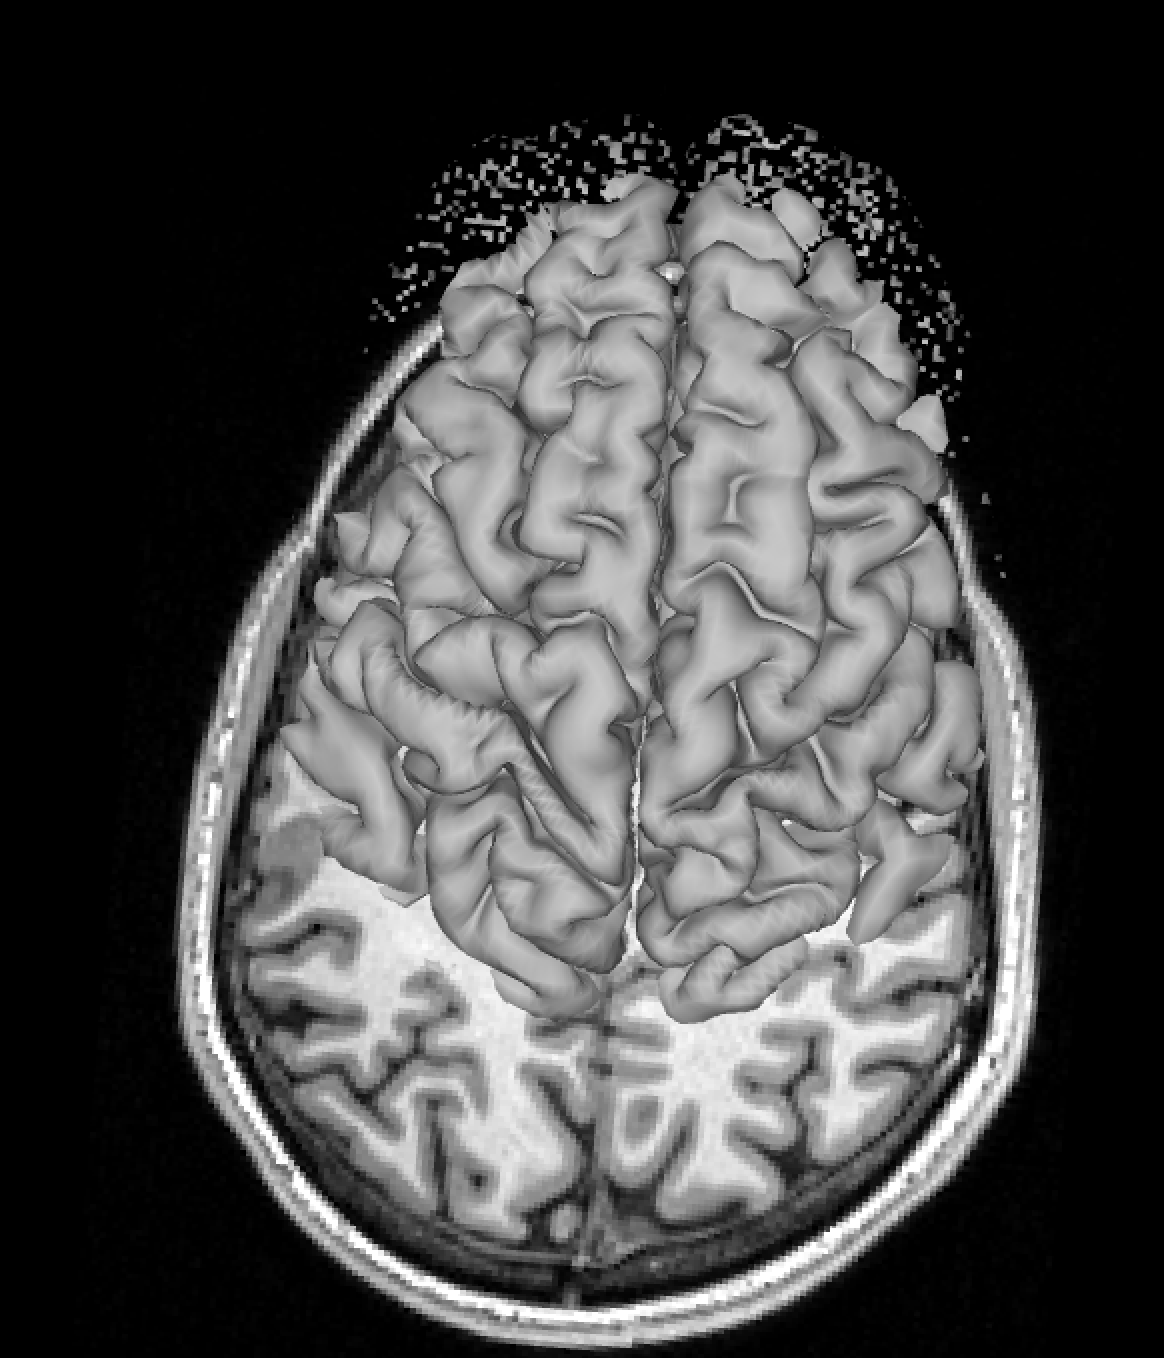
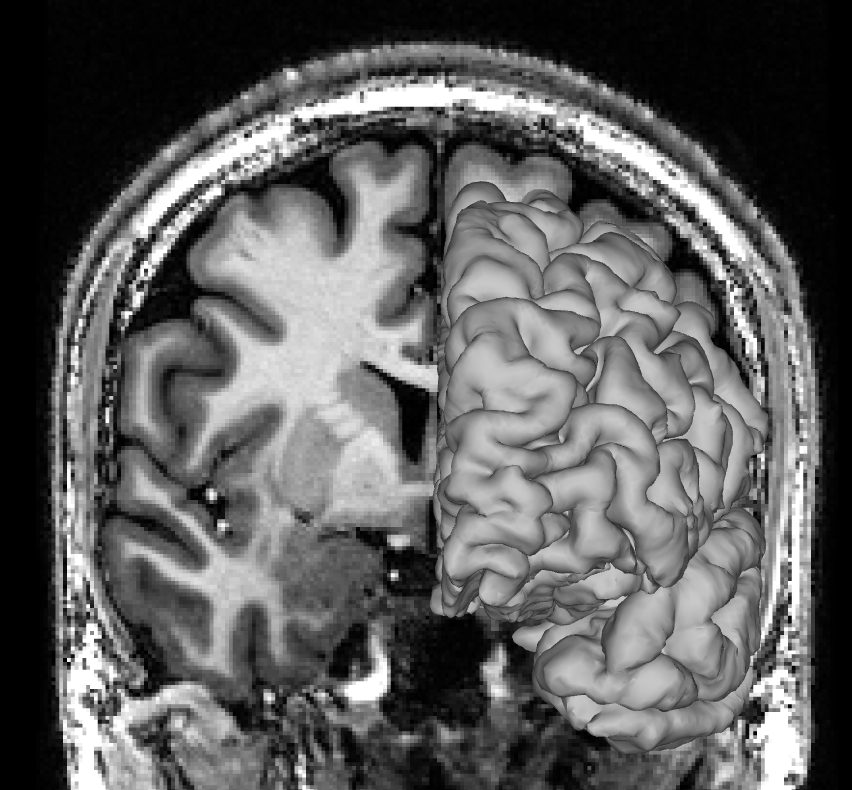
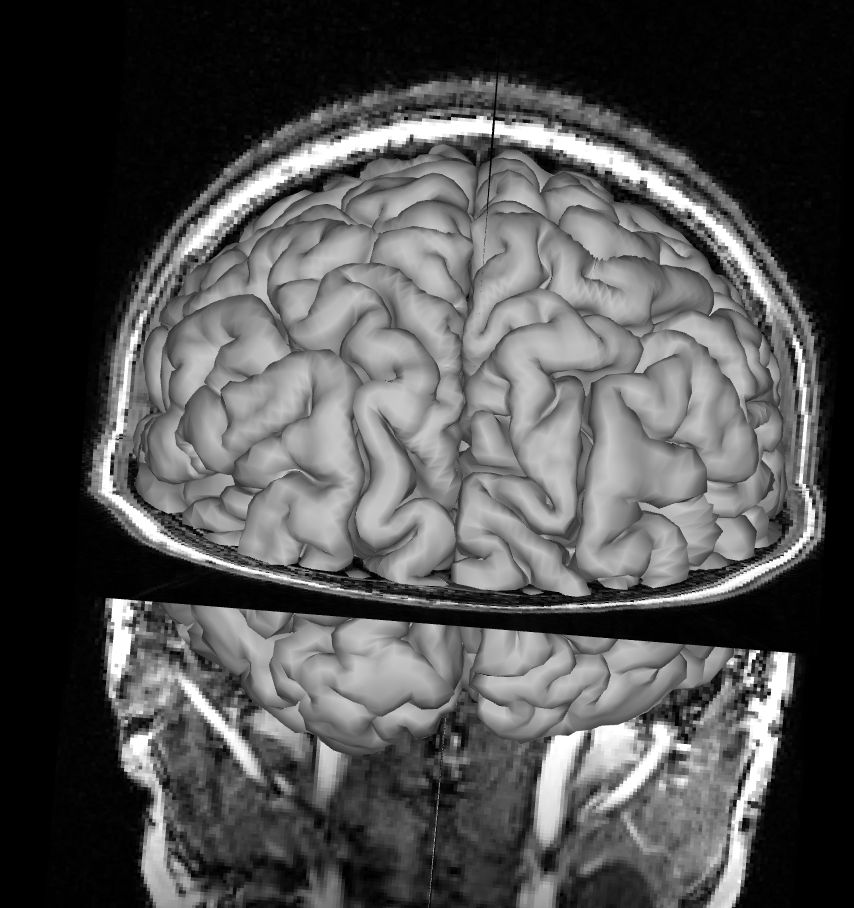
Remove the pial surface and add the white matter surface reconstruction. Make sure you removed the pial surface from you viewer, otherwise you won’t see the white matter surface under the pial surface. Follow the same process as for the pial surface check, click on All and rotate the image to see how T1 and the white matter surface align. Mismatches for the white matter surface should be easy to spot since the white matter surface at the cortex should neatly fit into the grey matter on the T1 like below.

Focus on the white matter surface going into the coronal T1 slice, not the saggital slice. Since the white matter connects the hemispheres only at the corpus callosum, which is hidden behind the rest of the white matter in this view, it’s hard to spot mismatches to the saggital T1 slice. Instead, look at where the white matter surface enters the coronal slice and the axial slice.
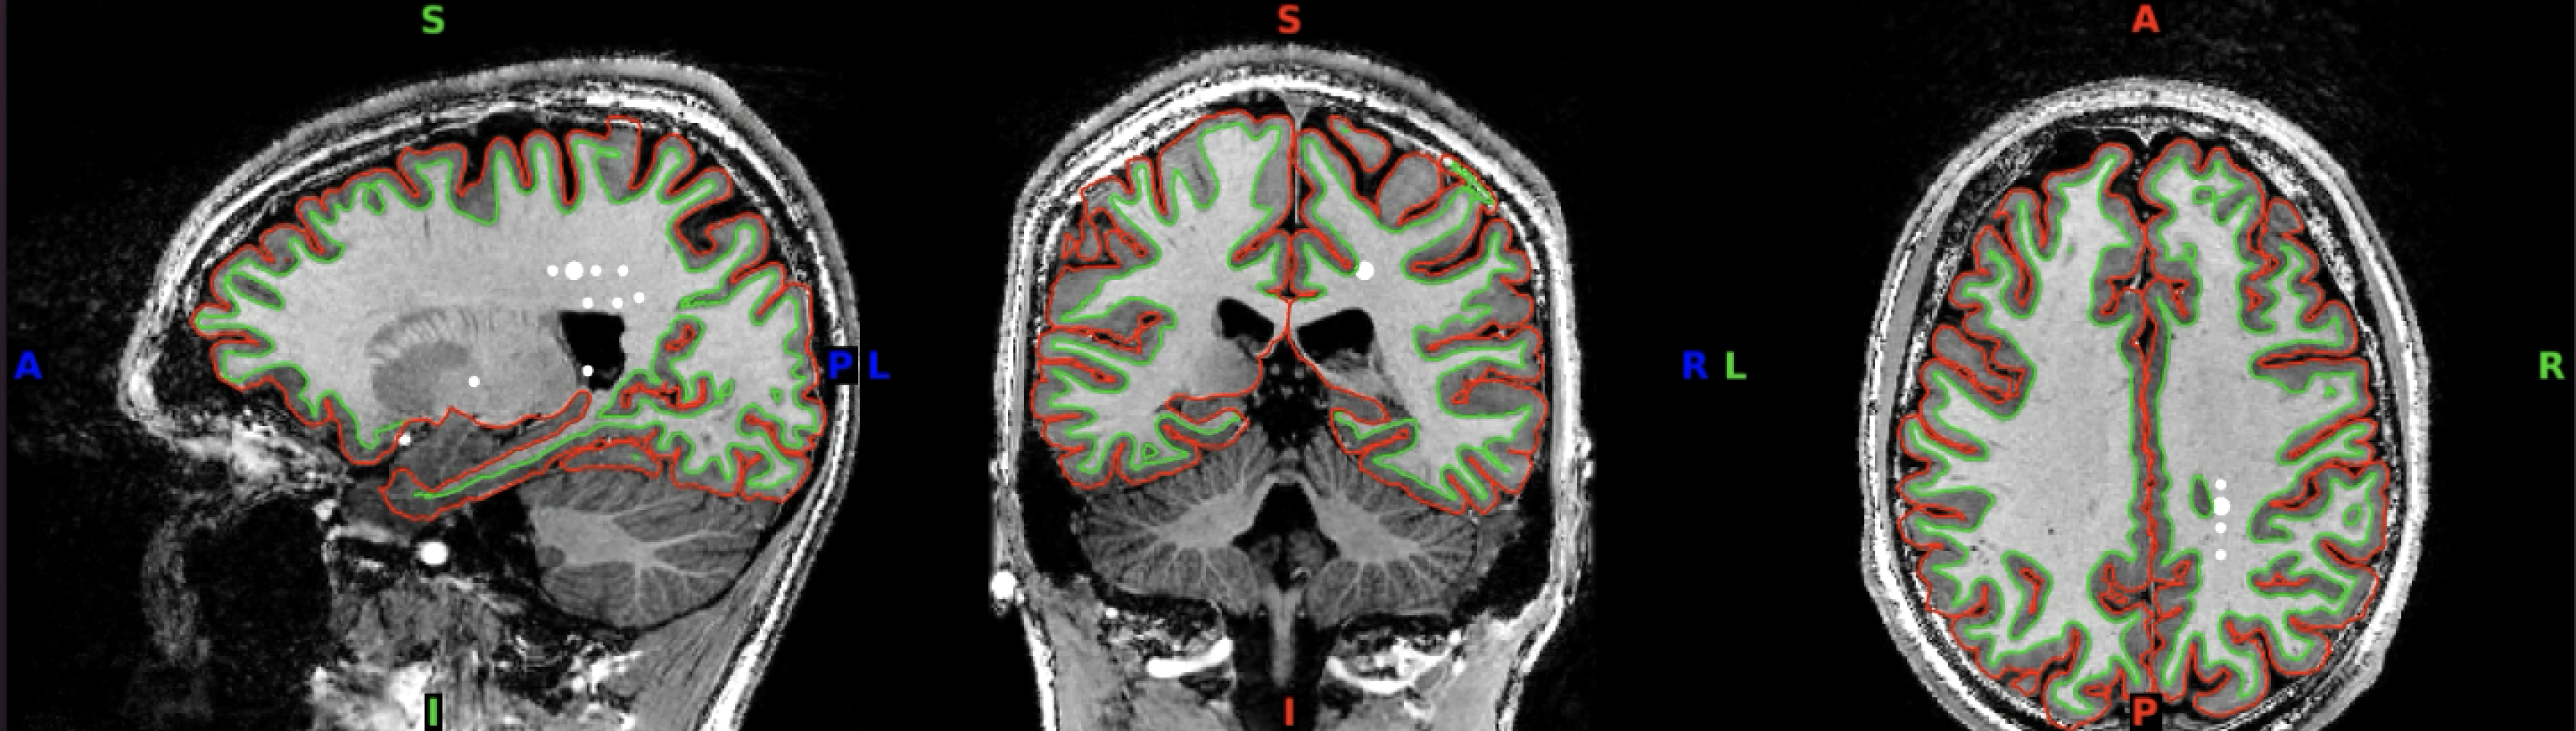
Outline inspection
For a different view of the surfaces, inspect the outline of the surface reconstructions in 2D. For this, load both the white matter and the pial surfaces into wb_view along with the T1. Click on ‘Volume’ view and ‘All’ to see the axial, coronal and saggital slices.
Then, click on the pial and white matter surfaces and select red for the pial surface and lime for the white matter surface.
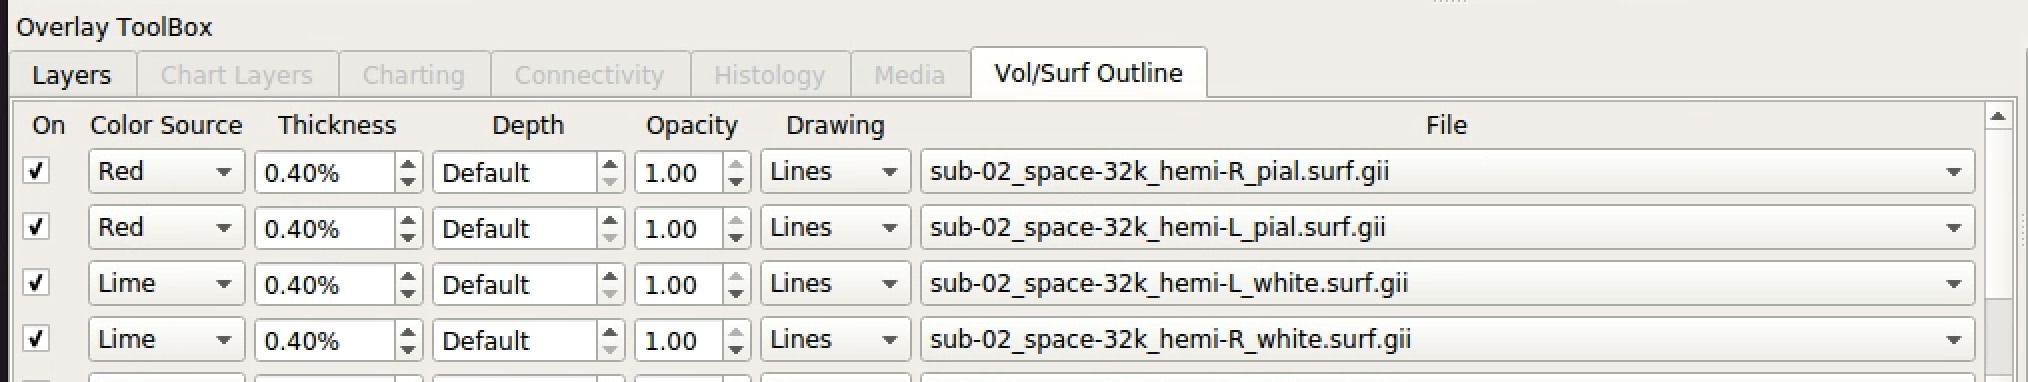
If you have selected these surfaces to be visible, you should now see something like this:
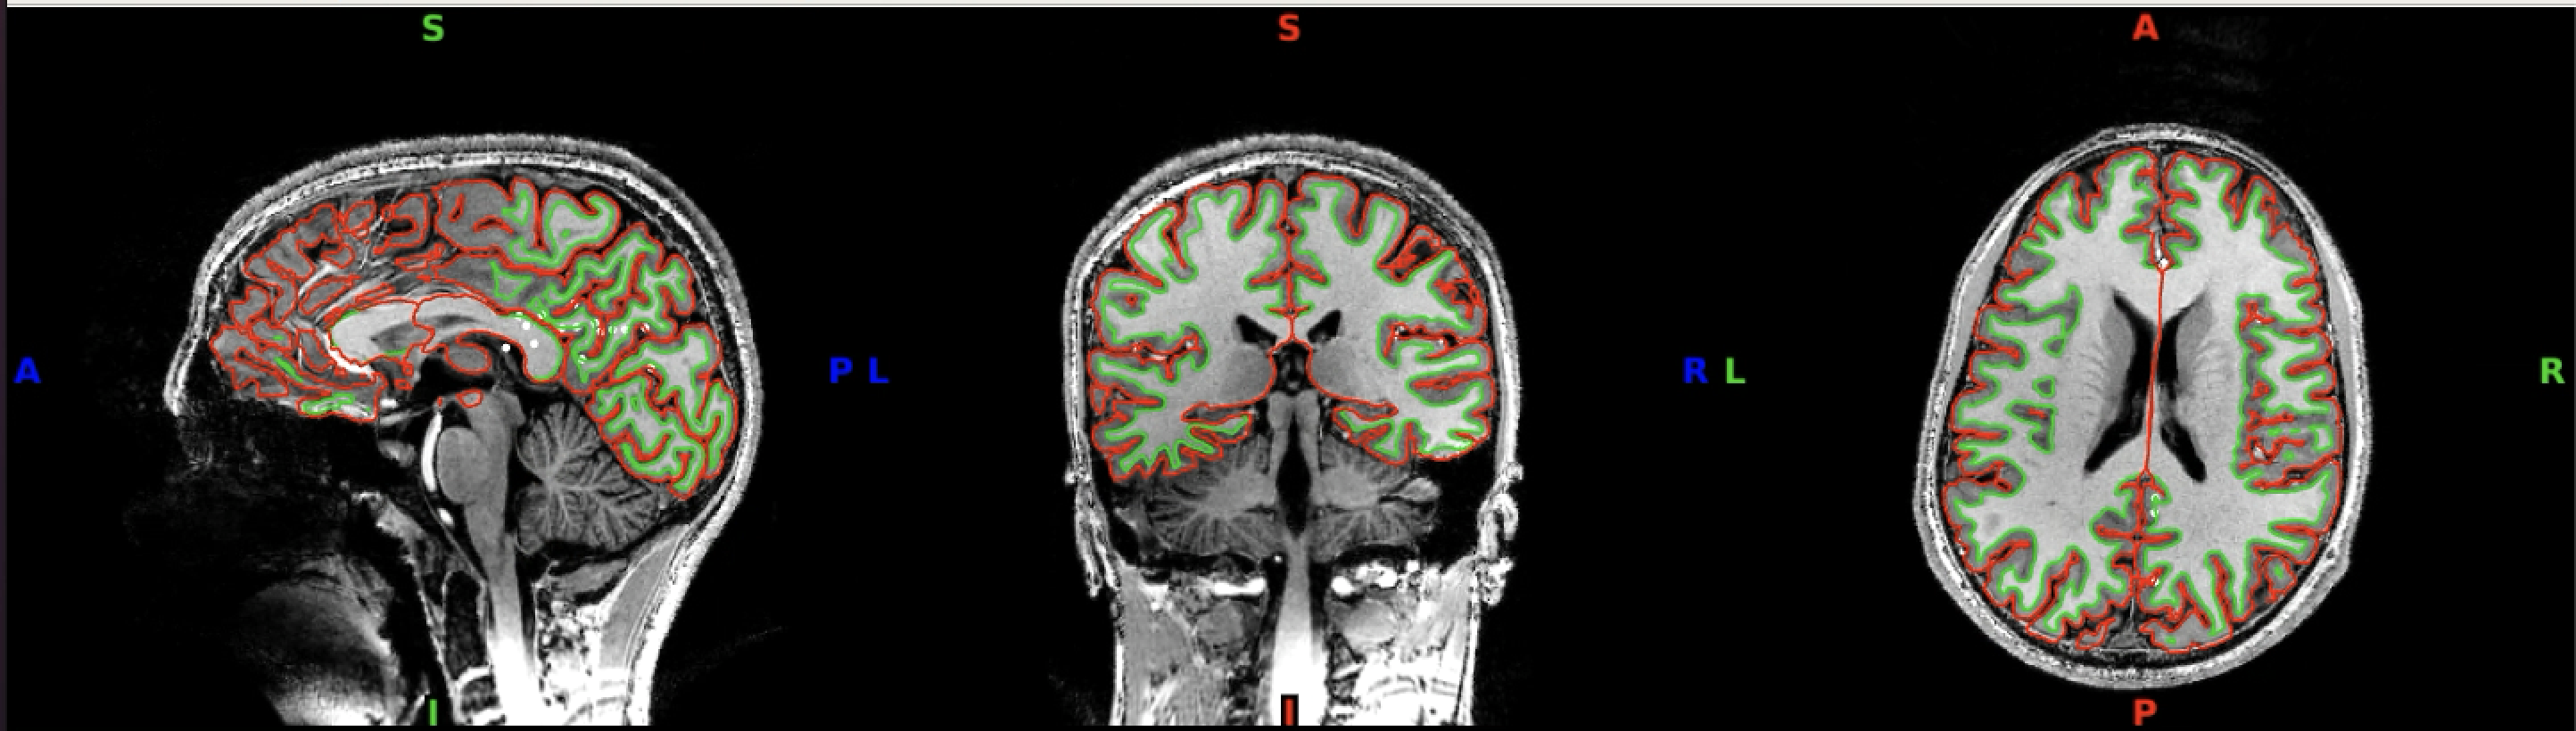
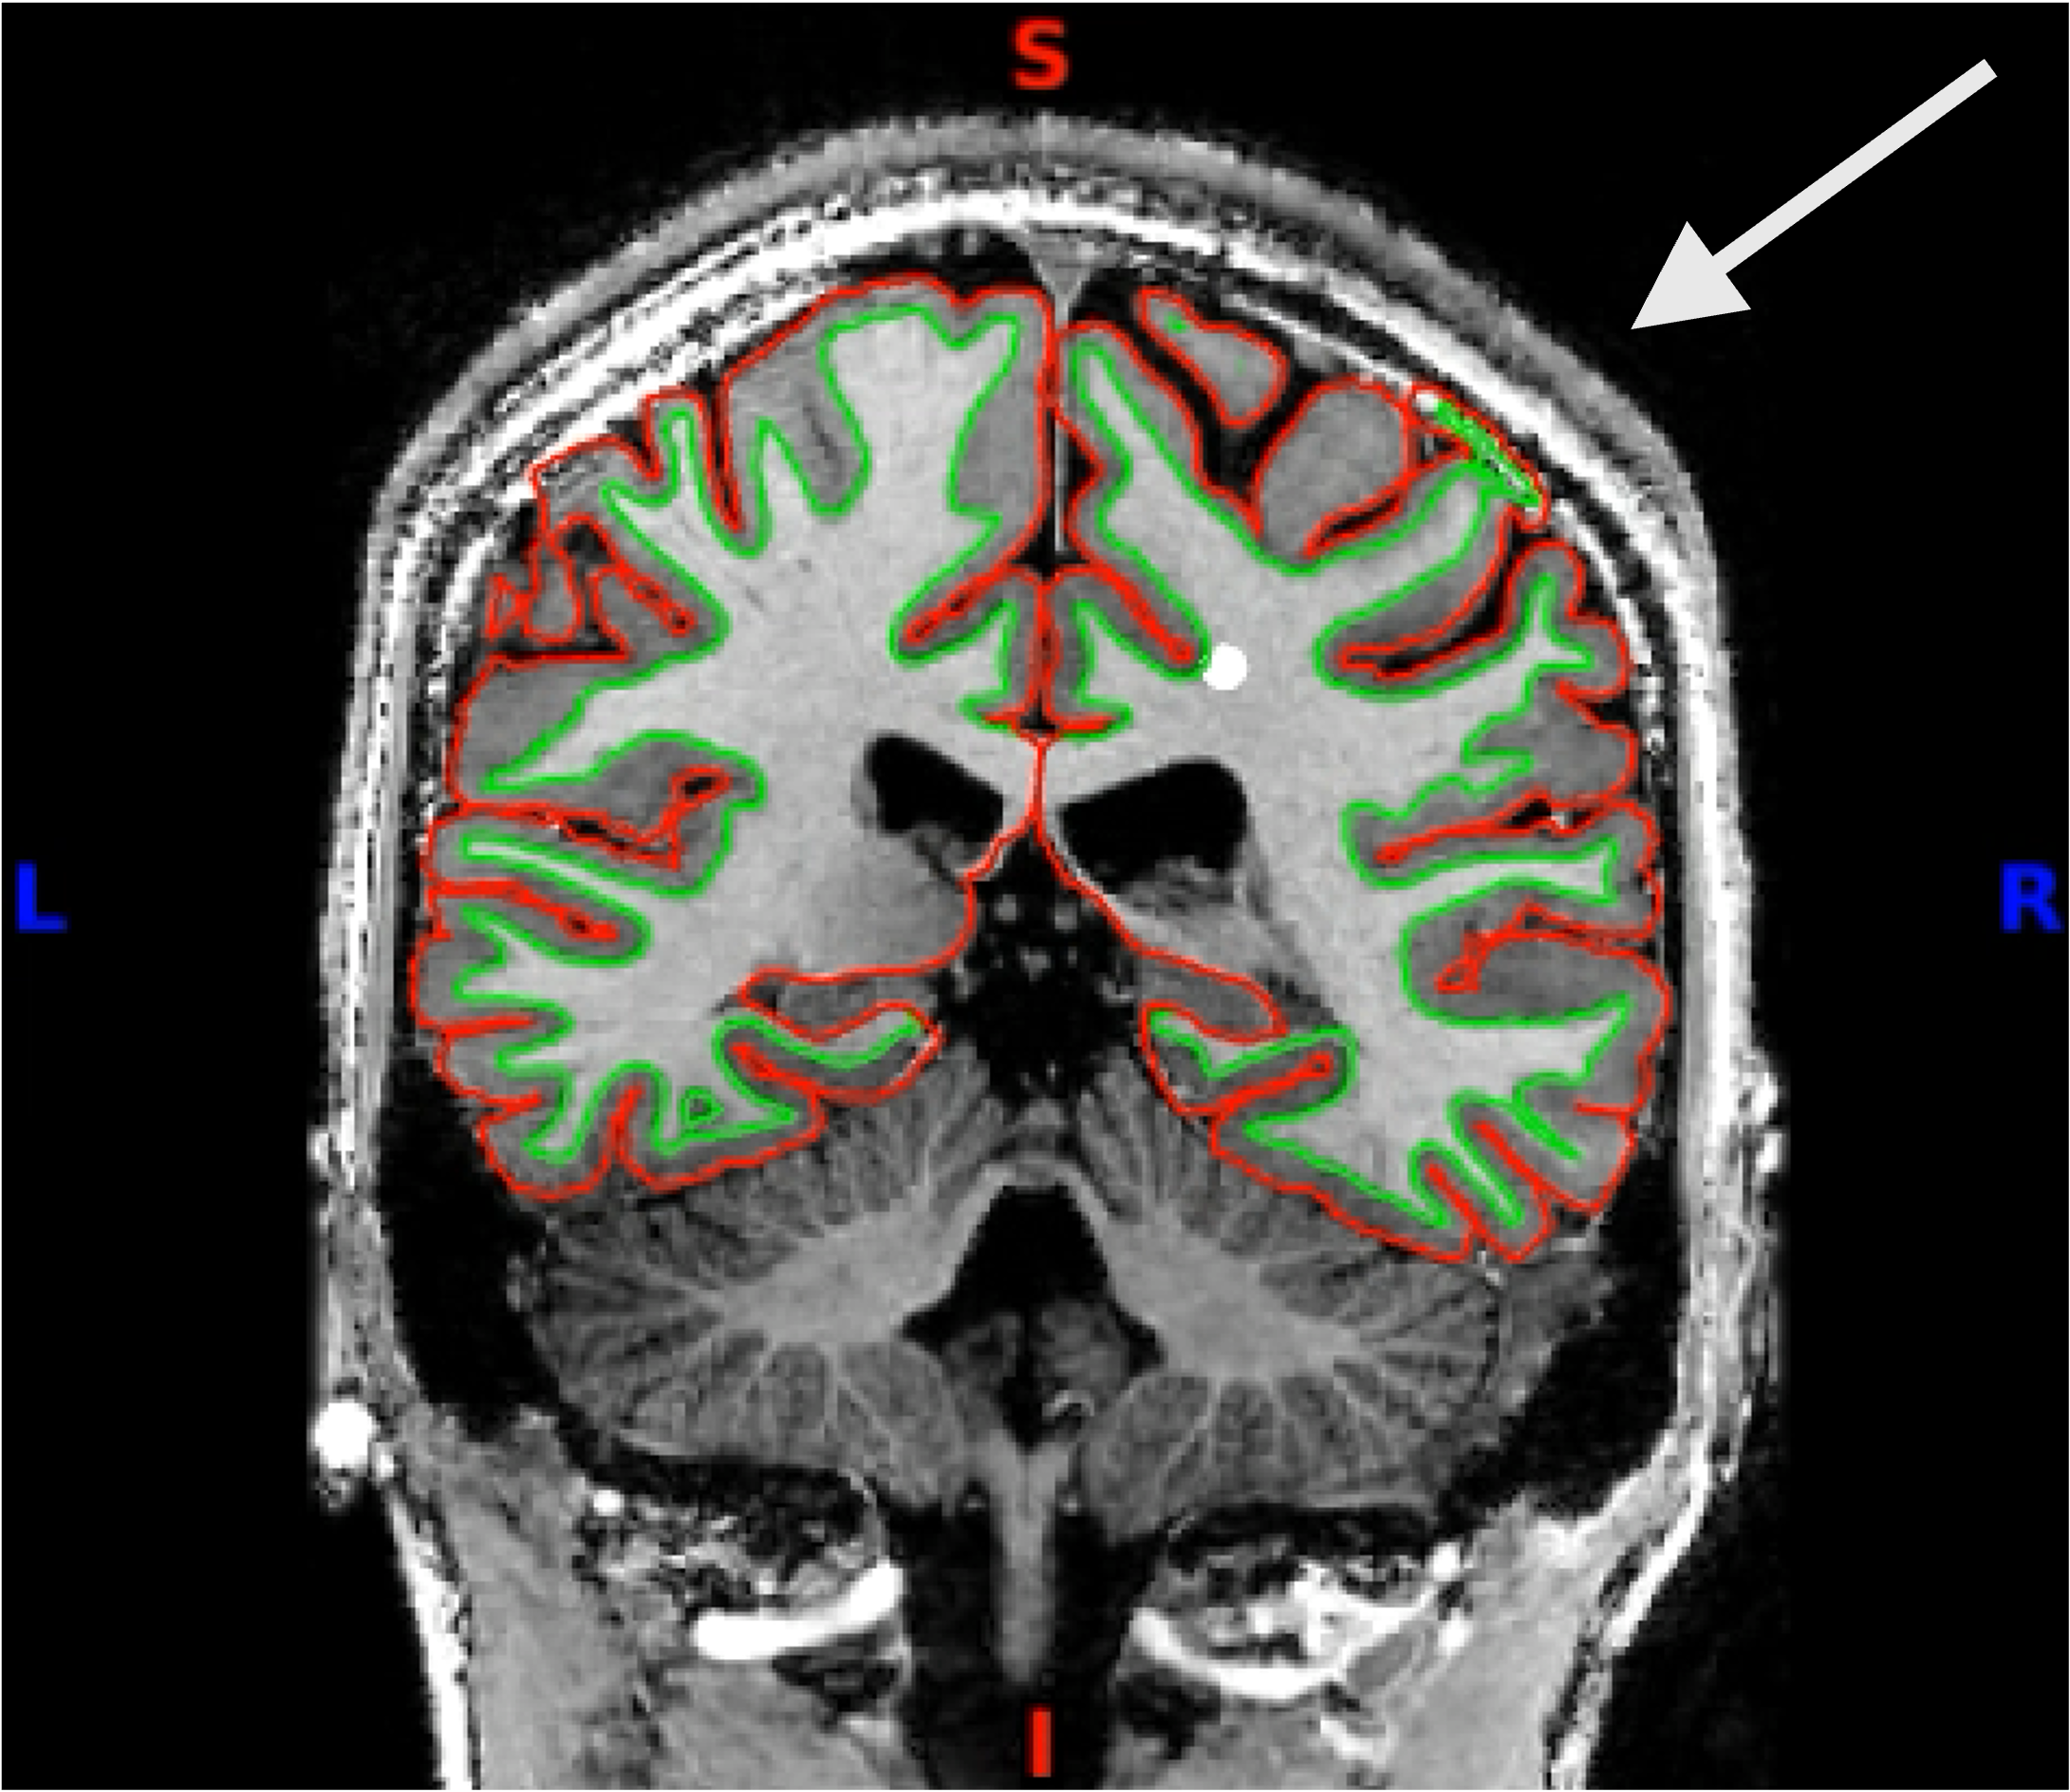
You can click through the volume and see if you spot any faulty reconstructions. In the below example, the right hemisphere has been misconstructed. Both white and pial surfaces are going into the skull on the right side. This will lead to wrong projections of the functional data - in this case, there was a chunk of ‘NaN’ values in the superior right hemisphere.
Here you can see it more closely:
Functional Data
Group Averaged Functional Data
To check whether your functional data makes sense, you can average the activity across all your subjects for each task or task condition. For visualising the group average in surface space, it is useful to save it as a cifti file. You can find a good introduction to cifti files and some resources to get you started here.
After saving your group average activation maps as a cifti file, open the group averaged data in the workbench viewer (wb_view). Depending on which space you the data is in, you will first have to load the space defining file. For example, if you want to insepct data on the fs32k surfaces, you will first have to load the .spec file for the fs32k space. Afterwards, you can load in the group average cifti file.
Look at some contrasts you are familiar with and where you know what to expect. For example, a left hand movement task should give you high activation in the right M1 hand area:
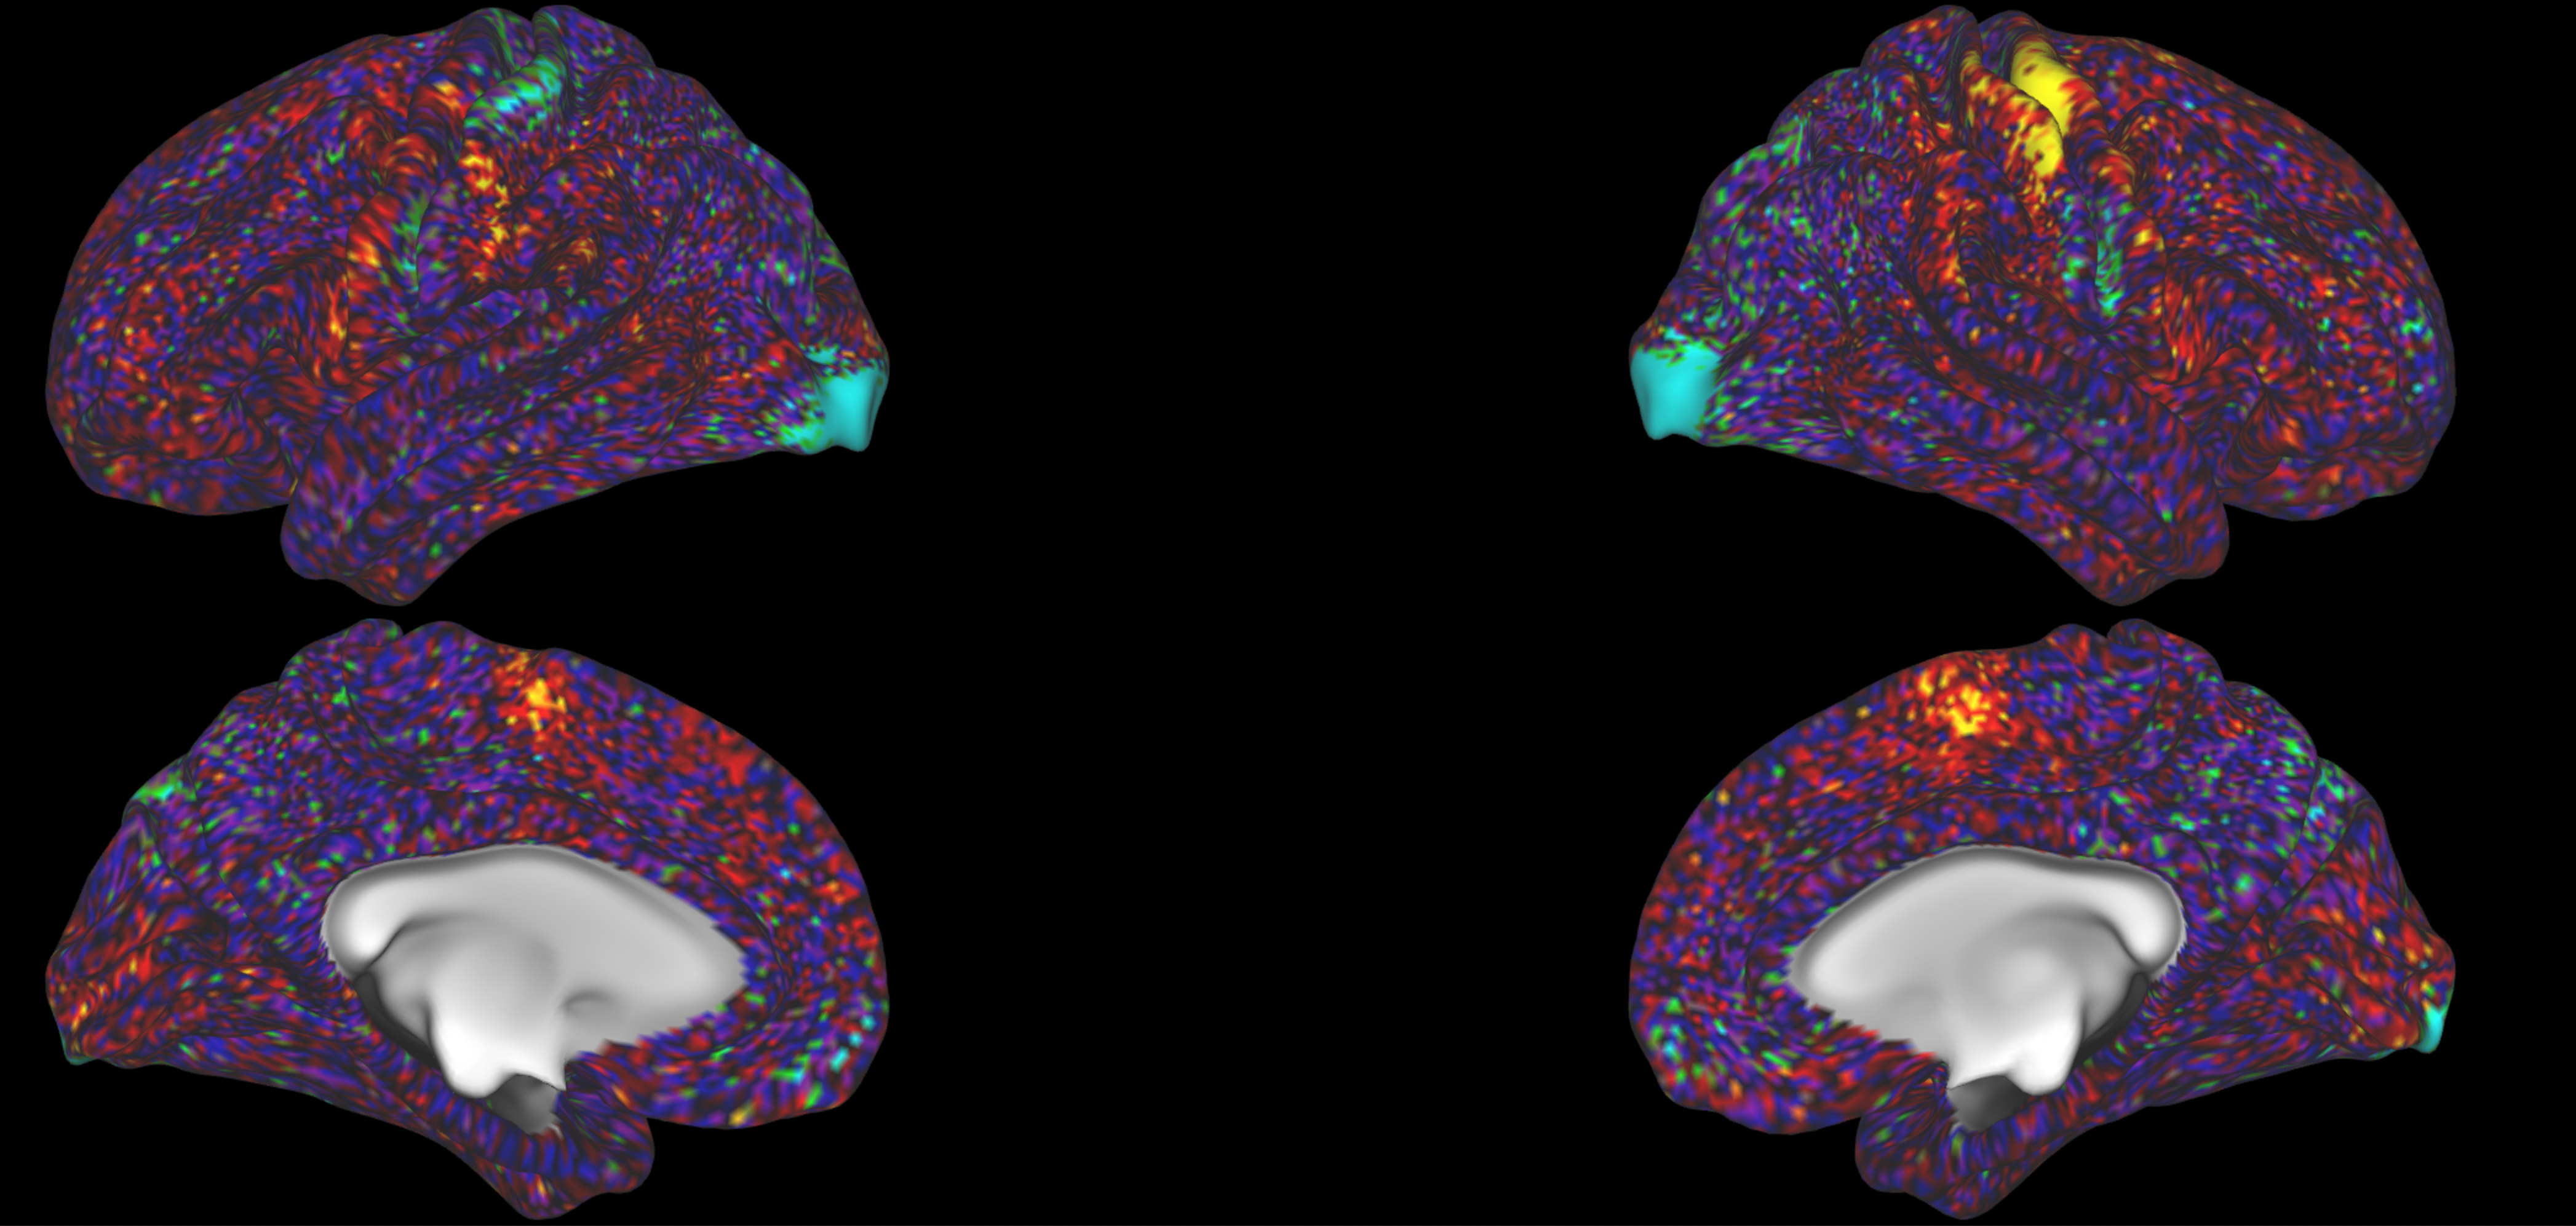
And the right hand movement task should give you left M1 hand area activation.
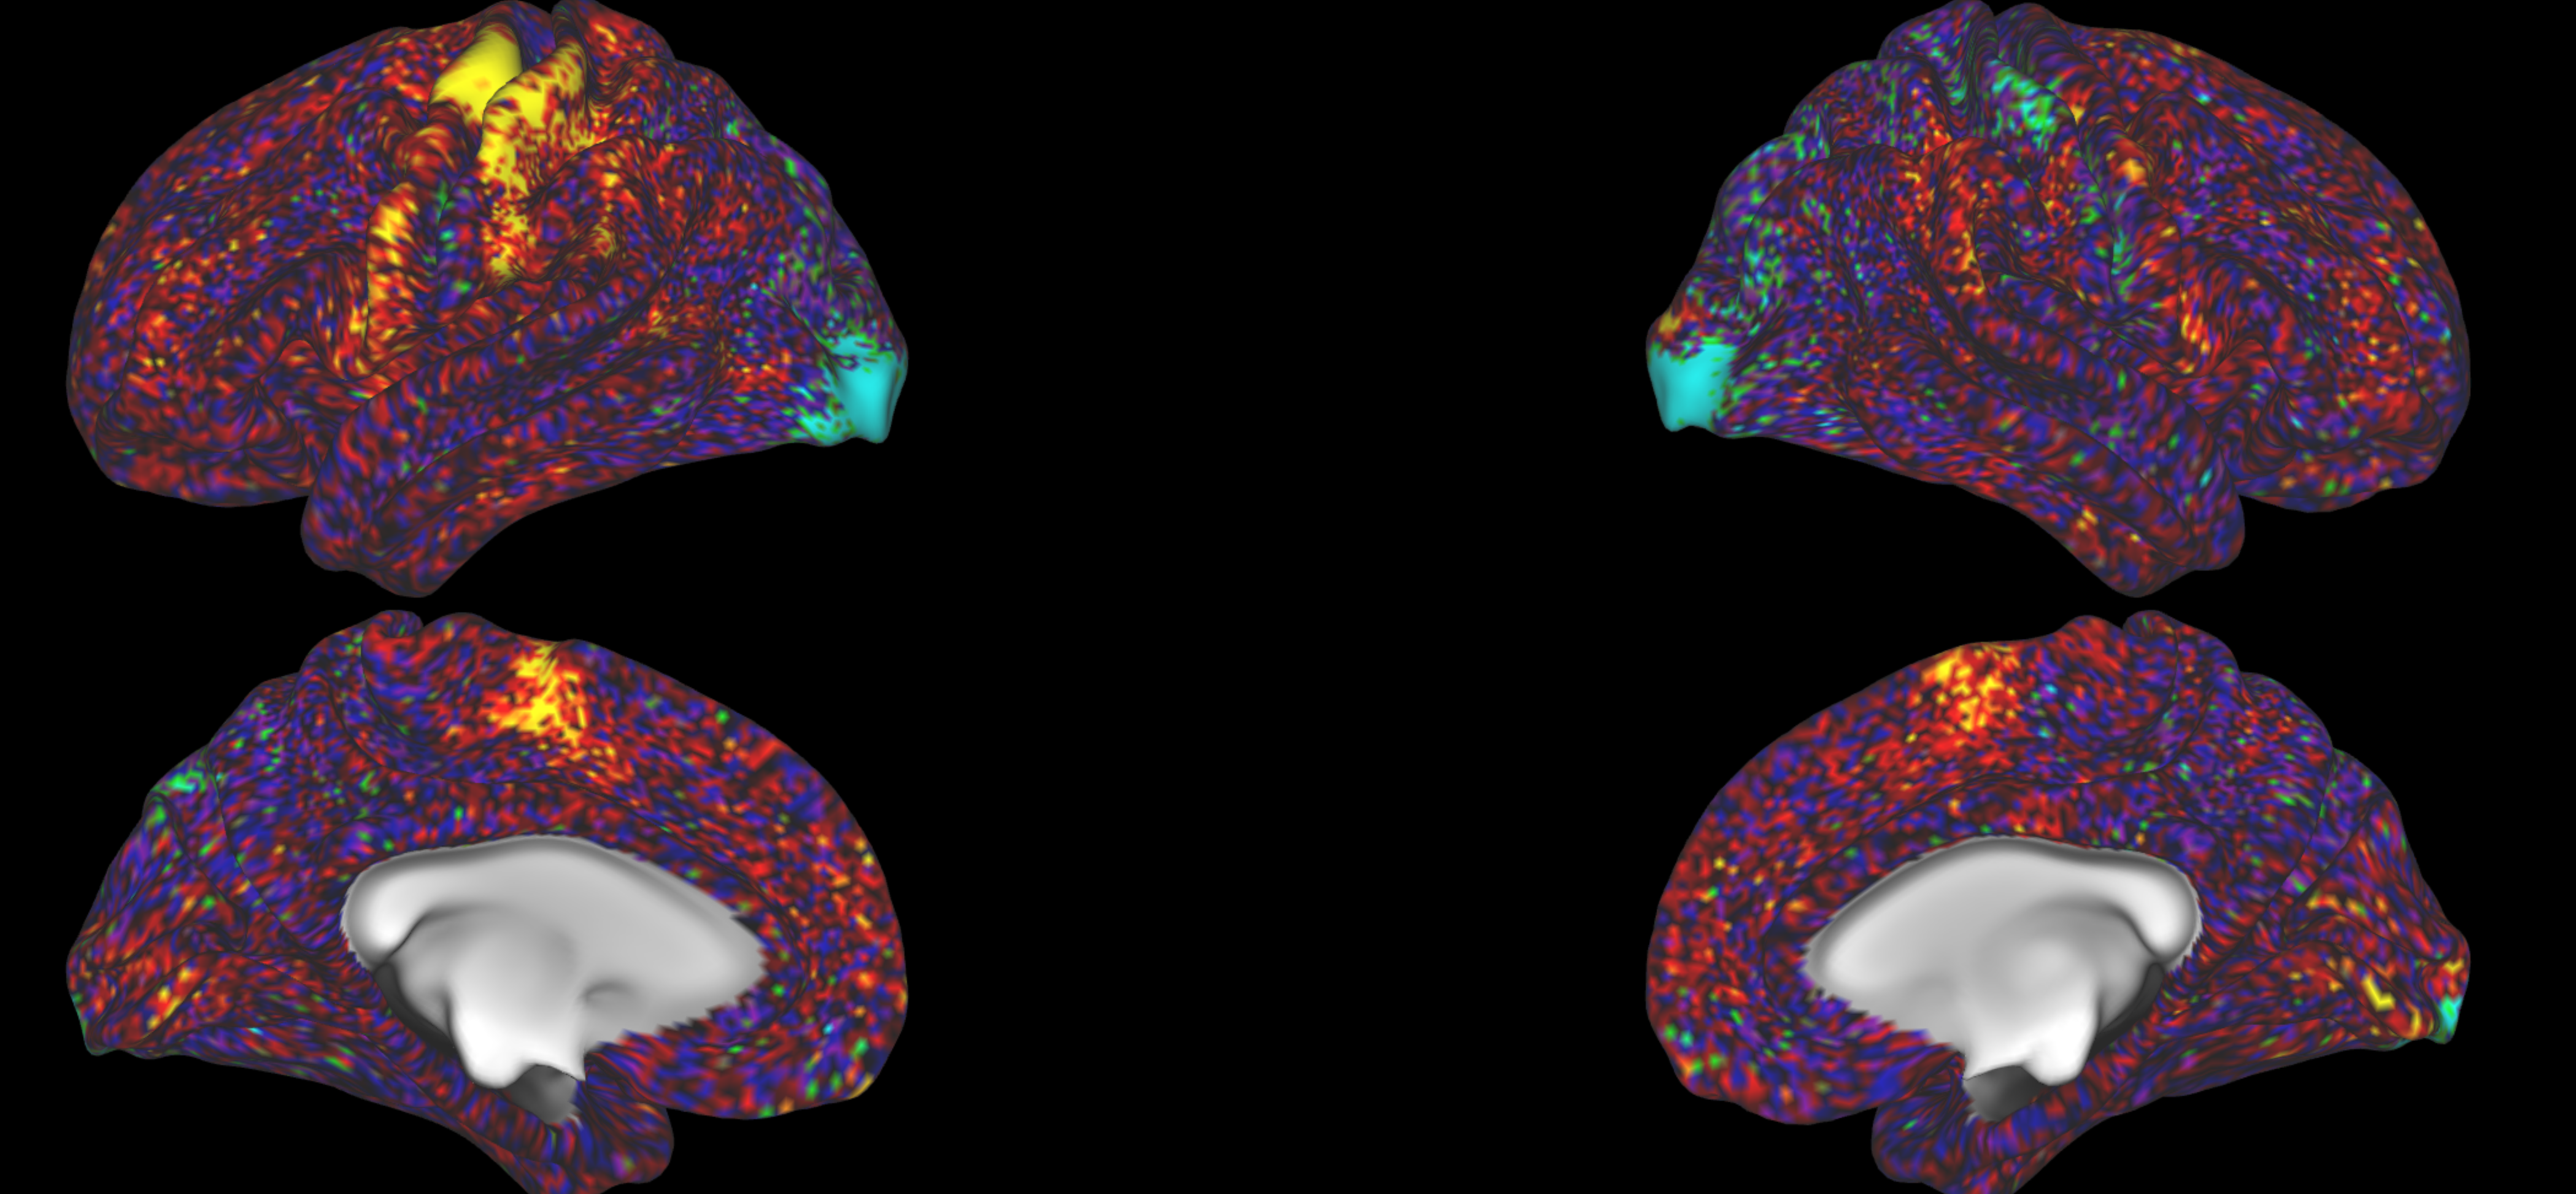
You can also check visual tasks, where you would expect activation in the visual cortices:
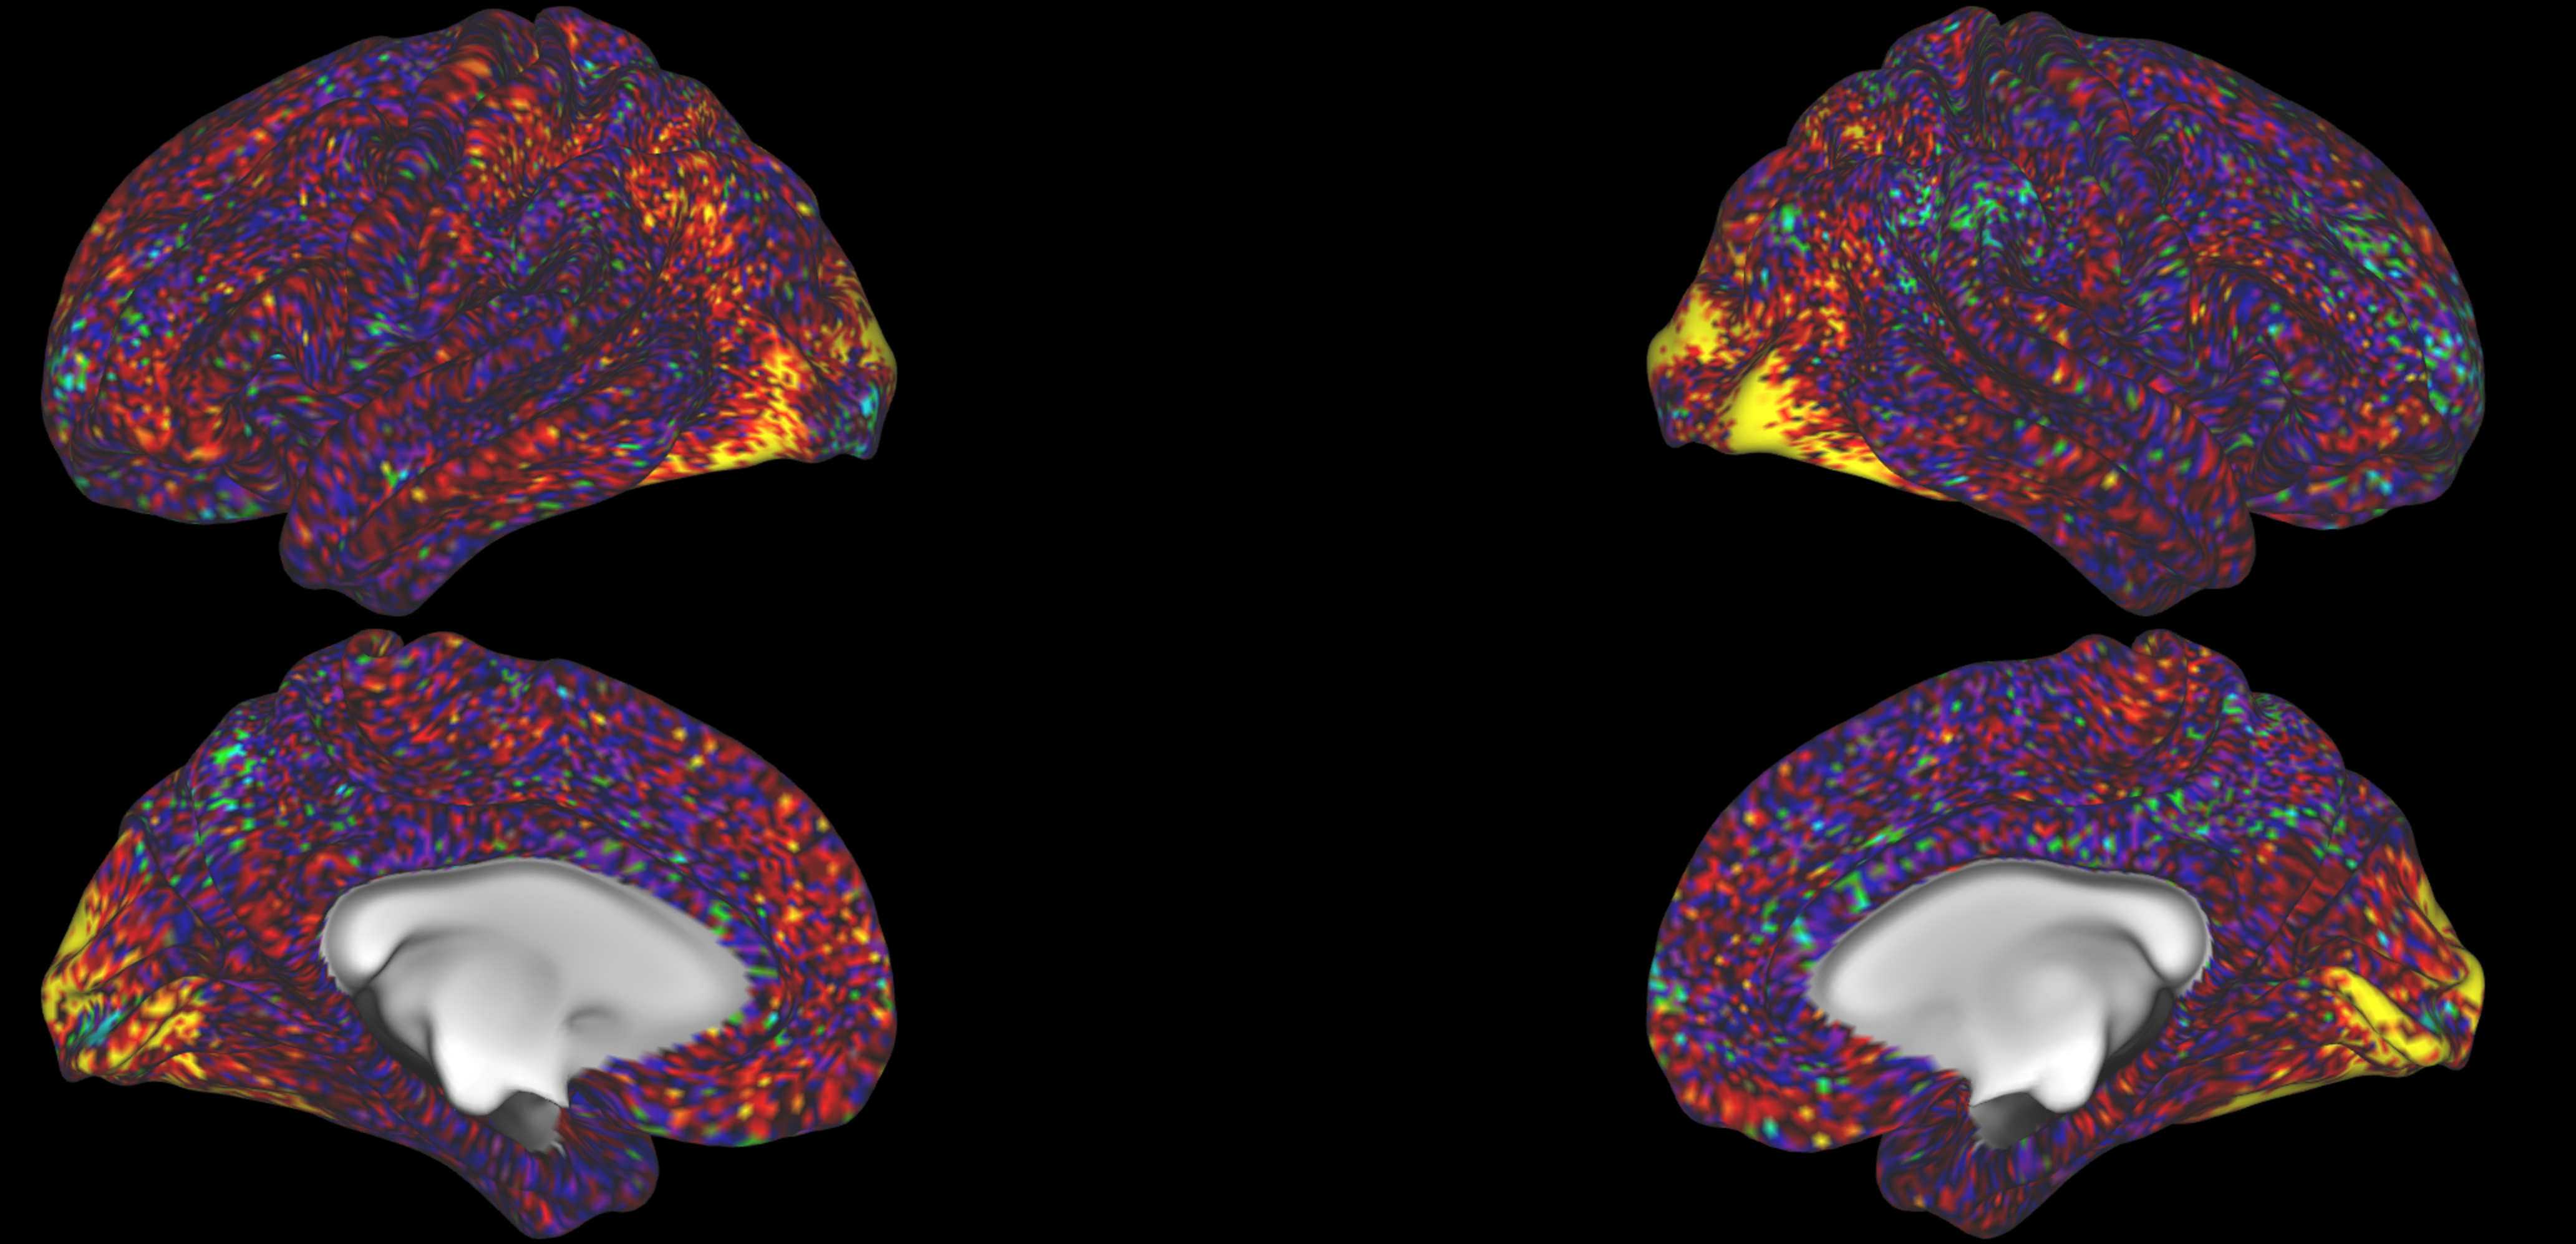
These inspections should confirm that on average, you are seeing activity in the areas that you would expect for the different tasks.